
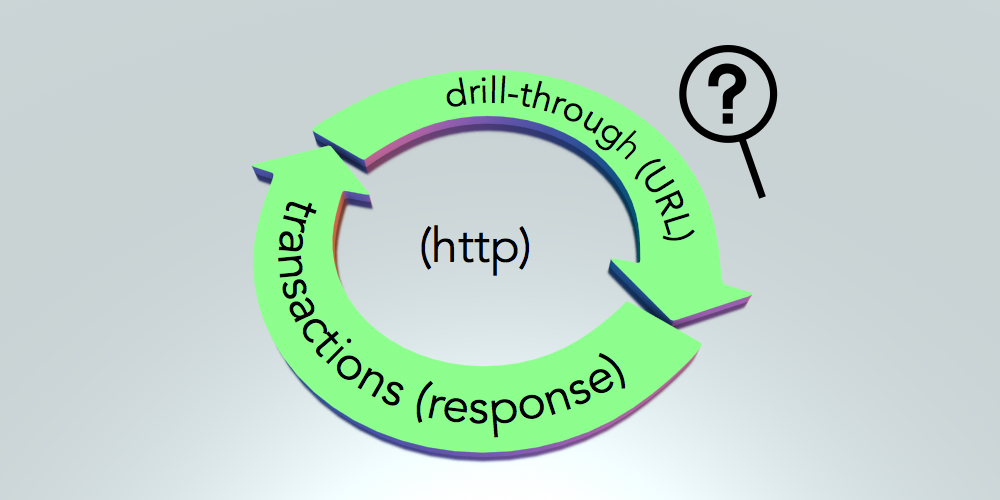
Reporting or ad-hoc analysis of summarized data values is often sufficient but there are times when you or your client may be looking for more functionality. I frequently get requirements for “drill-through”. Drill-through in this context means a user is able to navigate from the data values shown in one application into transactions (or source data) that make up that amount. In the Oracle Enterprise Performance Management (EPM) world that usually means Hyperion Planning, Oracle Essbase, Financial Reporting, etc… At least a basic understanding of HTTP (hyper-text transfer protocol) is important. For the purpose of this discussion we will assume there are essentially two types of solutions that deal with drill-through:
- Solutions that use HTTP
- Solutions that do not use HTTP
This post assumes that you are using the first type of solution. Meaning, a drill-through solution that is initiated by an HTTP request. If you are comfortable with HTTP requests and web-application technology in general then you can just skip down to the next section: “The Challenge”.
If you are working with an application that supports URL drill-through, there must be a way to define the “complete address” for a drill-through location as a Uniform Resource Locator (URL) for this post to be of any use. If you are lucky enough to remember them, a URL is kind of like the index cards used at a library or the aisle and bin labels at stores (like IKEA) that tell you where to find your products. In addition to the base URL, parameters will typically be added to an HTTP request to pass additional information. Using the IKEA example, a parameter to the HTTP request might be the ID of the specific product you want to find on a shelf. (product=300.643.59)
A URL is something you have probably used even if you don’t realize it. For example, this post was most likely accessed by opening your web-browser and entering the following URL: https://icodealot.com/ or clicking on the link from somewhere else that brought you here. As you navigate around this blog and click on links, the URL in your web-browser will change. These URLs tell the server what you are looking for (or what you are requesting). When working with HTTP for drill-through we are primarily concerned with two types of actions:
- An HTTP request - The request represents the Client to Server action. The client puts together some information and then “submits the request” to an HTTP server. The text contained within the request is structured in a way that an HTTP server will know how to process the request.
- An HTTP response - The response represents the Server to Client action. The server processes the request data from the client, performs some action and then returns some results to the Client in the form of a response. Although not always true, this response is usually formatted so that an HTTP client (i.e.: web browser) can process the response.
For more information on URLs refer to this article which provides a nice overview and for more information about HTTP requests refer to this article.
The Challenge
As a developer, administrator, or system integrator how can you debug the drill-through request generated by your application? There are times during development or configuration when you need to be able to inspect the HTTP request that is being generated by your application. This could apply in general to other areas of concern for HTTP but I am using the idea of drill-through since that is what I come across most often. For this example, let’s assume that you are enabling a drill-through location in Oracle Essbase that will launch a request to some application (via URL) for transaction details. Also, you have a burning desire, for some strange reason, to see the HTTP request parameters that are being passed from Essbase to the target URL.
How do we inspect the HTTP drill-through request?
The rest of this post will walk you through one possible solution for dealing with this using a technology called “Node.js” which is both a framework and an interpreter for running JavaScript-based programs. This is fairly technical. I will not stop to explain every detail along the way. I also assume that you have access to install software and/or administrative privileges to your application or the ability to make changes to the drill-through target location.)
NB. I am not a Node.js expert. I am simply a technologist and love experimenting with new ways to do things. For me, Node.js seemed like a good choice for this activity and it has the additional benefit of being HTTP-enabled by default. You can take the ideas presented here and apply them in whatever technology you are most comfortable with. HTTP is a well-implemented standard and other technologies support it with similar abstractions / functionality.
One Solution
According to the good people over at http://nodejs.org, “Node.js® is a platform built on Chrome’s JavaScript runtime for easily building fast, scalable network applications. Node.js uses an event-driven, non-blocking I/O model that makes it lightweight and efficient, perfect for data-intensive real-time applications that run across distributed devices.”
Step 1: Get Node.js
This sounds like a pretty good fit to me! So the first step is to head over to http://nodejs.org/download/ then download and install Node.js for your operating system of choice. I am running this from my Windows laptop but you could also run this from a server if you are willing and able to install Node.js on a server.
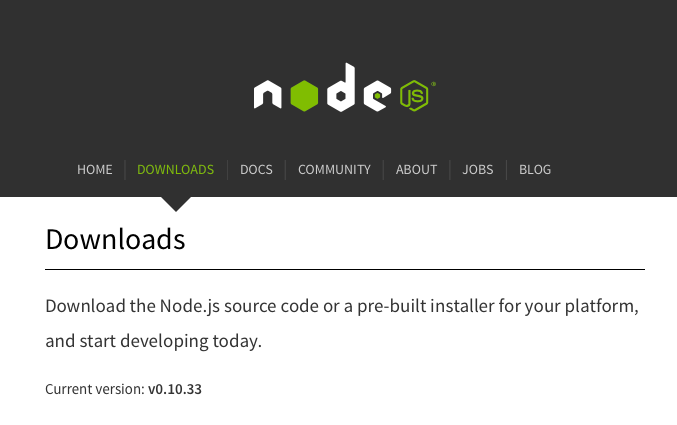
Node.js website and download page. (http://nodejs.org)
Once you have Node.js installed somewhere you should be able to open a DOS command prompt or Unix shell and run the “node” executable. Run this command node --version. Depending on what version of Node.js and what operating system you are running you should see output similar mine.
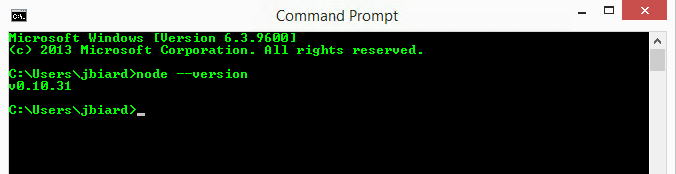
Sample output from running “node --version” in the DOS emulator on Windows.
If you don’t see similar output or you get an error, check with the documentation on the Node.js website or Google.com for more information. From my experience, installing Node.js should not be all that different from installing any other program on your system.
Step 2: Create A Program
The next step is to open your favorite text editor (Notepad++, Sublime, TextMate, VIM, etc…) and prepare a new file for input. Once you have your text editor open with a blank file add the following JavaScript source code to the file. Don’t worry, this is not a programming class. This is also not meant to be a JavaScript tutorial. If you start with my example, you can expand from there as needed or try out other techniques to build on this approach.
var http = require('http');
http.createServer(function (req, res) {
  req.on('end', function () {
    res.write('Drill-through rocks!');
    res.end();
  });
}).listen(1337, '127.0.0.1');
console.log('Server running.');
Once you have entered the code into a text file, save it as “drill-through.js” in a folder that you can easily get to on your system. For example, I created a new folder on my C: drive called “http” and inside that folder I saved this script as “drill-through.js”. I assume you have done the same thing to follow along but if not, simply adjust the examples as needed with your path and file names.
Step 3: Test The Program
We need to verify that Node.js is installed correctly and test our sample program. We can do all of that in this step. Start by opening up an command prompt if you don’t already have one open. Change directories into the location of your program (created in the previous step) by running a command such as cd c:\http. Finally, start your Node.js program by running the following command node drill-through.js. (assuming you named your program drill-through.js)
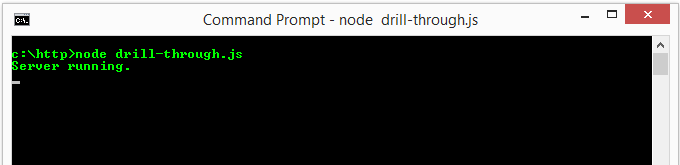
Starting our sample node.js program. (An HTTP server)
If you see output similar to that shown above, congratulations! You have just created an HTTP server in node.js. If you don’t see output like that shown above you’ll need to debug what’s going on in your environment. Check to make sure node.js is installed correctly, that the program is typed or copied / pasted correctly, etc… Now open up a web browser and navigate to the following URL, or just click on this link: http://127.0.0.1:1337/drill-through. You should see something like the following show up in your web browser.
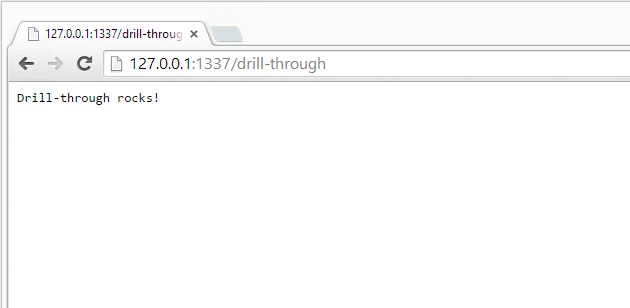
Sample output from the HTTP server we created in Step 3.
Step 4: Inspect the HTTP Request
Now that we have a working HTTP server, let’s expand our node.js program to deal with the HTTP request. By adding a few new lines of code, we will be able to inspect the contents of the HTTP request data that comes from the drill-through operation. If you don’t have it open still, open your copy of “drill-through.js” and add the following lines of code. (highlighted in red) You can also just copy and paste the whole program into your file but I recommend typing it in.
var http = require('http');
http.createServer(function (req, res) {
  var postData = '';
  req.on('data', function (datum) {
    postData += datum;
  });
  req.on('end', function () {
    res.write('Drill-through rocks!');
    res.write('\nHEADERS:\n' + JSON.stringify(req.headers)
            + '\nURL:\n' + req.url
            + '\nBODY:\n' + postData);
    res.end();
  });
}).listen(1337, '127.0.0.1');
console.log('Server running.');
Once you have the code above entered into your “drill-through.js” program, save the code and restart the program. If your previous program is still running you may have to press Control+C or Control+D to exit the program and then you can restart the program by typing “node drill-through.js”. Now if you open your web browser and type in the same URL (or just hit Refresh if you never closed your browser) you will see output similar to the following.
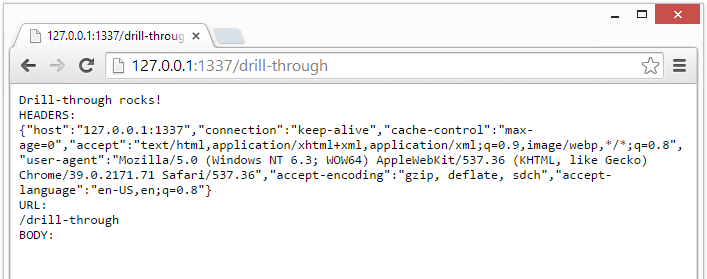
Sample output with the HTTP request inspected.
In this example I am using the Chrome web browser. If you are using IE, Firefox, Safari or anything else then your output may looks slightly different. The main point to note here is that you can now inspect the HTTP request data that is being sent to your program (which is actually an HTTP server). There are three sections in this output including the HEADERS, the URL, and the BODY. Each of these sections will present different values depending on the method used by the application that is launching the drill-through request.
Step 5: Update Drill-Through URL
The last step of this process is to start your “drill-through.js” program if it is not already running and then to update your application’s drill-through URL. Each application has a different way to define a drill-through URL so I will not cover those steps here. In this example, I have supplied a drill-throuh URL to Essbase using Essbase Administration Services Console. My URL looks something like this:
http://127.0.0.1:1337/drill-through?$ATTR(ds,id,pos,gen,level.edge)$
I replaced the original server:port with my own information. The first part of this URL should look familiar to you already. The last part of this URL is something Essbase uses to supply a point of view dynamically on drill-through. Whatever format your drill-through URL takes, make sure that you enter the drill-through URL with the correct IP address and PORT number (for the first part) as shown 127.0.0.1:1337. (The /drill-through part is completely fictitious... use your own drill-through URL as the real template) Now that Essbase is configured to use our own HTTP server for drill-through, let’s open Essbase and perform a drill-through operation to see what happens.
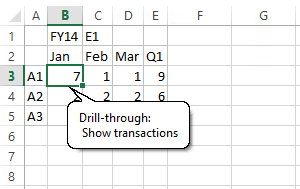
Drill-through from Essbase to a URL.
I am using Oracle Smart View for this example to connect to an Essbase application that has been configured for a URL-based drill-through. When you complete the drill-through operation as shown here, Smart View will open a web browser and attempt to drill-through to the URL we configured. This URL happens to point to the HTTP server running on our local machine so it will not really go anywhere. Instead, this will pass the drill-through request to our [Node.js] program and print out the results.
Drill-through rocks!
HEADERS:
{"accept":"text/html, application/xhtml+xml, */*","content-type":"application/x-www-form-url encoded","accept-language":"en-US","user-agent":"Mozilla/5.0 (Windows NT 6.3; WOW64; Trident/7.0;     Touch; rv:11.0) like Gecko","accept-encoding":"gzip, deflate","host":"127.0.0.1:1337","content-    length":"633","int":"1","connection":"Keep-Alive"}
URL:
/drill-through
BODY: attribute=Period.id.Jan&attribute=Account.id.A1&attribute=Year.id.FY14&attribute=Entity.id.E1&attribute=Period.edge.col&attribute=Period.pos.0&attribute=Period.level.0&attribute=Period.gen.4&attribute=Account.edge.row&attribute=Account.pos.0&attribute=Account.level.0&attribute=Account.gen.2&attribute=Year.edge.report&attribute=Year.level.0&attribute=Year.gen.2&attribute=Entity.edge.report&attribute=Entity.level.0&attribute=Entity.gen.3&attribute=system.ds.essbase&attribute=server.ds.*****&attribute=app.ds.****APP&attribute=database.ds.****DB&attribute=alias.ds.Default&applicationtype=officeAddin
Using this approach, you should now be able to debug your URL drill-through configurations to understand and inspect what is happening upon drill-through. This can be useful for a number of reasons. There are many other solutions, languages, tools (such as Wireshark), etc... that can be implemented to achieve similar results. I hope you find this technique useful and that it helps you in your own understanding of how to debug HTTP requests that are being sent between applications and specifically with drill-through technologies that use HTTP for their solution.
PS: Special Consideration For Servers
The example shown above assumes that we are running this HTTP server from a local machine and also performing the drill-through operation from that same machine. If you decide to run this program from a server, or if you need to be able to access this custom drill-through URL from other places on your network then you will need to make some small changes to the program.
- You will update the IP address to be the actual IP instead of 127.0.0.1
- You will [probably] need to choose a more appropriate PORT number instead of 1337
Both of these changes apply to this line of code: listen(1337, ‘127.0.0.1’);. In addition to these changes, you may also need to update firewall rules if you are using a firewall at any point in your network to restrict access. If you were unable to connect to the HTTP server throughout the examples shown above then there is a good change you have a firewall blocking communication to the system that is running your program. If you don’t completely follow this then support from an infrastructure / network administration team may be necessary. Thanks for following along.
Cheers!